The Power of Reflection: How Athletes Can Use an After Action Review (AAR) to Improve Performance

Athlete consulting for Elite Performance Nutrition Program

Introduction: Why an AAR Matters

In the world of competitive sports, athletes are always striving for continuous improvement. Whether it’s shaving milliseconds off a sprint time, improving endurance, or perfecting a technical skill, the journey to excellence is a never-ending cycle of effort and evaluation. One tool that is crucial for any athlete looking to break through plateaus and optimize performance is the After Action Review (AAR).

The AAR, borrowed from military practices, is a structured review that helps athletes reflect on their goals, assess their progress, and pinpoint both successes and setbacks. The beauty of an AAR is in its objectivity—it’s about being honest with yourself, owning both achievements and failures, and learning from each season. While coaches offer critical external feedback, an AAR helps athletes take ownership of their development by analyzing what worked, what didn’t, and where they can improve.


The Benefits of an AAR

  1. Clarity of Goals and Expectations

   It’s easy to lose sight of goals during a demanding training cycle. The AAR helps you reflect on the goals you set at the beginning of the season and whether they were realistic given your fitness, time, and competition level. This allows you to reassess for future seasons and set smarter, more achievable targets.

  1. Analyzing Performance Metrics

   Training data is abundant these days, with everything from power output to heart rate variability being tracked. But how do these metrics translate to your performance? Did your improved training power outputs reflect in race performance? The AAR bridges the gap between raw numbers and real results.

  1. Learning from Setbacks

   Everyone experiences setbacks. Injuries, inconsistent training, or even mental fatigue can all derail your progress. An AAR gives you a space to identify the root causes of any challenges you faced and create strategies to overcome them next season.

  1. Building Accountability

   One of the toughest things to do is take responsibility for your own progress. The AAR forces you to ask tough questions about your commitment, consistency, and focus. It’s not about being overly critical—it’s about learning to stay accountable and continually push toward your goals.


How to Conduct an Effective AAR

An AAR is most effective when it is detailed and structured. Start by listing your goals for the season, then assess whether those goals were achieved. Break it down further by examining Measures of Effectiveness (MOE)—your broad, outcome-based success markers—and Measures of Performance (MOP)—specific, process-based metrics that show how well you executed your plan.


Ask yourself the following:

  1. Were my goals realistic given my fitness, time, and commitment?
  2. Did my performance metrics align with my race or event results?
  3. What strengths did I exhibit, and where were my weaknesses?
  4. How will I adapt next season to improve upon this one?


When to Conduct an AAR

The ideal time for an AAR is immediately after a significant event or the close of a season. The key is to reflect while your performances are still fresh in your mind, allowing for honest and specific insights. While athletes often like to move forward quickly after a season, taking the time to thoroughly assess the past can lead to breakthroughs in future training.


Using an AAR to Plan for the Future

Once you’ve conducted your AAR, the next step is to adjust your training and goals accordingly. What did you learn about your weaknesses? What strategies worked? And what changes do you need to make to ensure more success in the future? Your AAR should not only help you understand the past but also be a guiding document to structure your next training cycle.


After Action Review (AAR) Questionnaire

Here’s a detailed AAR questionnaire that you can use to reflect on your past season. Be as honest and thorough as possible.


Discipline and Focus:

  1. What is your cycling discipline (e.g., track cycling, road cycling, mountain biking, etc.)?
  2. What is your specific focus within that discipline (e.g., Sprinter, Endurance)?


Season Goals and Expectations:

  1. What were your main goals and expectations at the start of the season?

   – Specify both outcome-based goals (e.g., improve 200m time to qualify for Match Sprints) and process-based goals (e.g., complete 90% of all scheduled training sessions).

  1. What were your Measures of Effectiveness (MOE) for these goals?

   – MOE are broad, outcome-based criteria that define success.  

   – Format: Verb + Noun + Current Measurement + Percentage Change + New Measurement + Date

   – Example: Increase 5-second power from 1000 watts by 10% to 1100 watts by June 5, 2024.

  1. What were your Measures of Performance (MOP) for these goals?

   – MOP are specific, process-based metrics that reflect how well you executed your training or strategy.  

   – Format: Verb + Noun + Current Measurement + Percentage Change + New Measurement + Date

   – Example: Complete 95% of scheduled gym and track sessions by August 2024.

  1. Did you successfully meet your MOP?

   – Yes / No / Partially  

   – If not, what factors affected your ability to meet your performance standards?

  1. Did meeting (or not meeting) your MOP lead to the expected MOE outcome?

   – Did your performance (MOP) drive success in achieving your broader goals (MOE)?

  1. Were your expectations for the season realistic based on your current fitness, time commitment, and competition level?

   – Yes / No  

   Explain why or why not.


Training and Adaptation:

  1. Did you adapt your training or strategy during the season when things weren’t going to plan?

   – Yes / No  

   If yes, what changes did you make? If no, why didn’t you adapt?

  1. Looking back, did you maintain consistency in your training?

   – Were there any challenges to maintaining consistency (e.g., scheduling, gym access, motivation)?

  1. Did you push yourself enough with heavier weights during your strength training?

   – Yes / No  

   If no, what will you do differently next season?

  1. Do you have any specific training tools or equipment (e.g., Wattbike, Nordic machine, K-box) that you haven’t fully utilized?

   – If yes, how will you integrate these into your routine moving forward?


Performance Analysis:

  1. How did your race or event performances compare to your training metrics (power, speed, time, etc.)?

   – Did you have data to validate your race performance compared to training? How did you improve?

  1. Did your body composition or fitness level align with your goals for the season?

   – Yes / No  

   If not, how could improving body composition or fitness help in the future?

Strengths and Weaknesses:

  1. What specific strengths contributed to your success this season?
  2. What specific weaknesses or limitations did you notice in your performance this season?


Recovery, Rest, and Mental Health:

  1. Did you make enough time for recovery and rest?
  2. How did you manage your mental health during the season, and do you feel it impacted your performance?


Support System:

  1. Reflect on your support system (coaches, family, training partners). Did you maximize it?
  2. How will you make sure to include tactical race practice (e.g., Match Sprints) in your training routine next season?


Season Reflections:

  1. What is your biggest takeaway from this season?
  2. What will you change or improve next season based on this AAR?


Final Tough-Love Reflection:

  1. If you were your own coach, what would you say to yourself about this season?


By using this AAR, you’ll be able to better understand your performance, your training habits, and how to structure future training cycles for better results. The key to improvement is honest reflection, so don’t be afraid to face your shortcomings head-on and take responsibility for your progress. Your next season starts with the lessons you learn today.

Five Underrated Habits for Getting Lean Fast

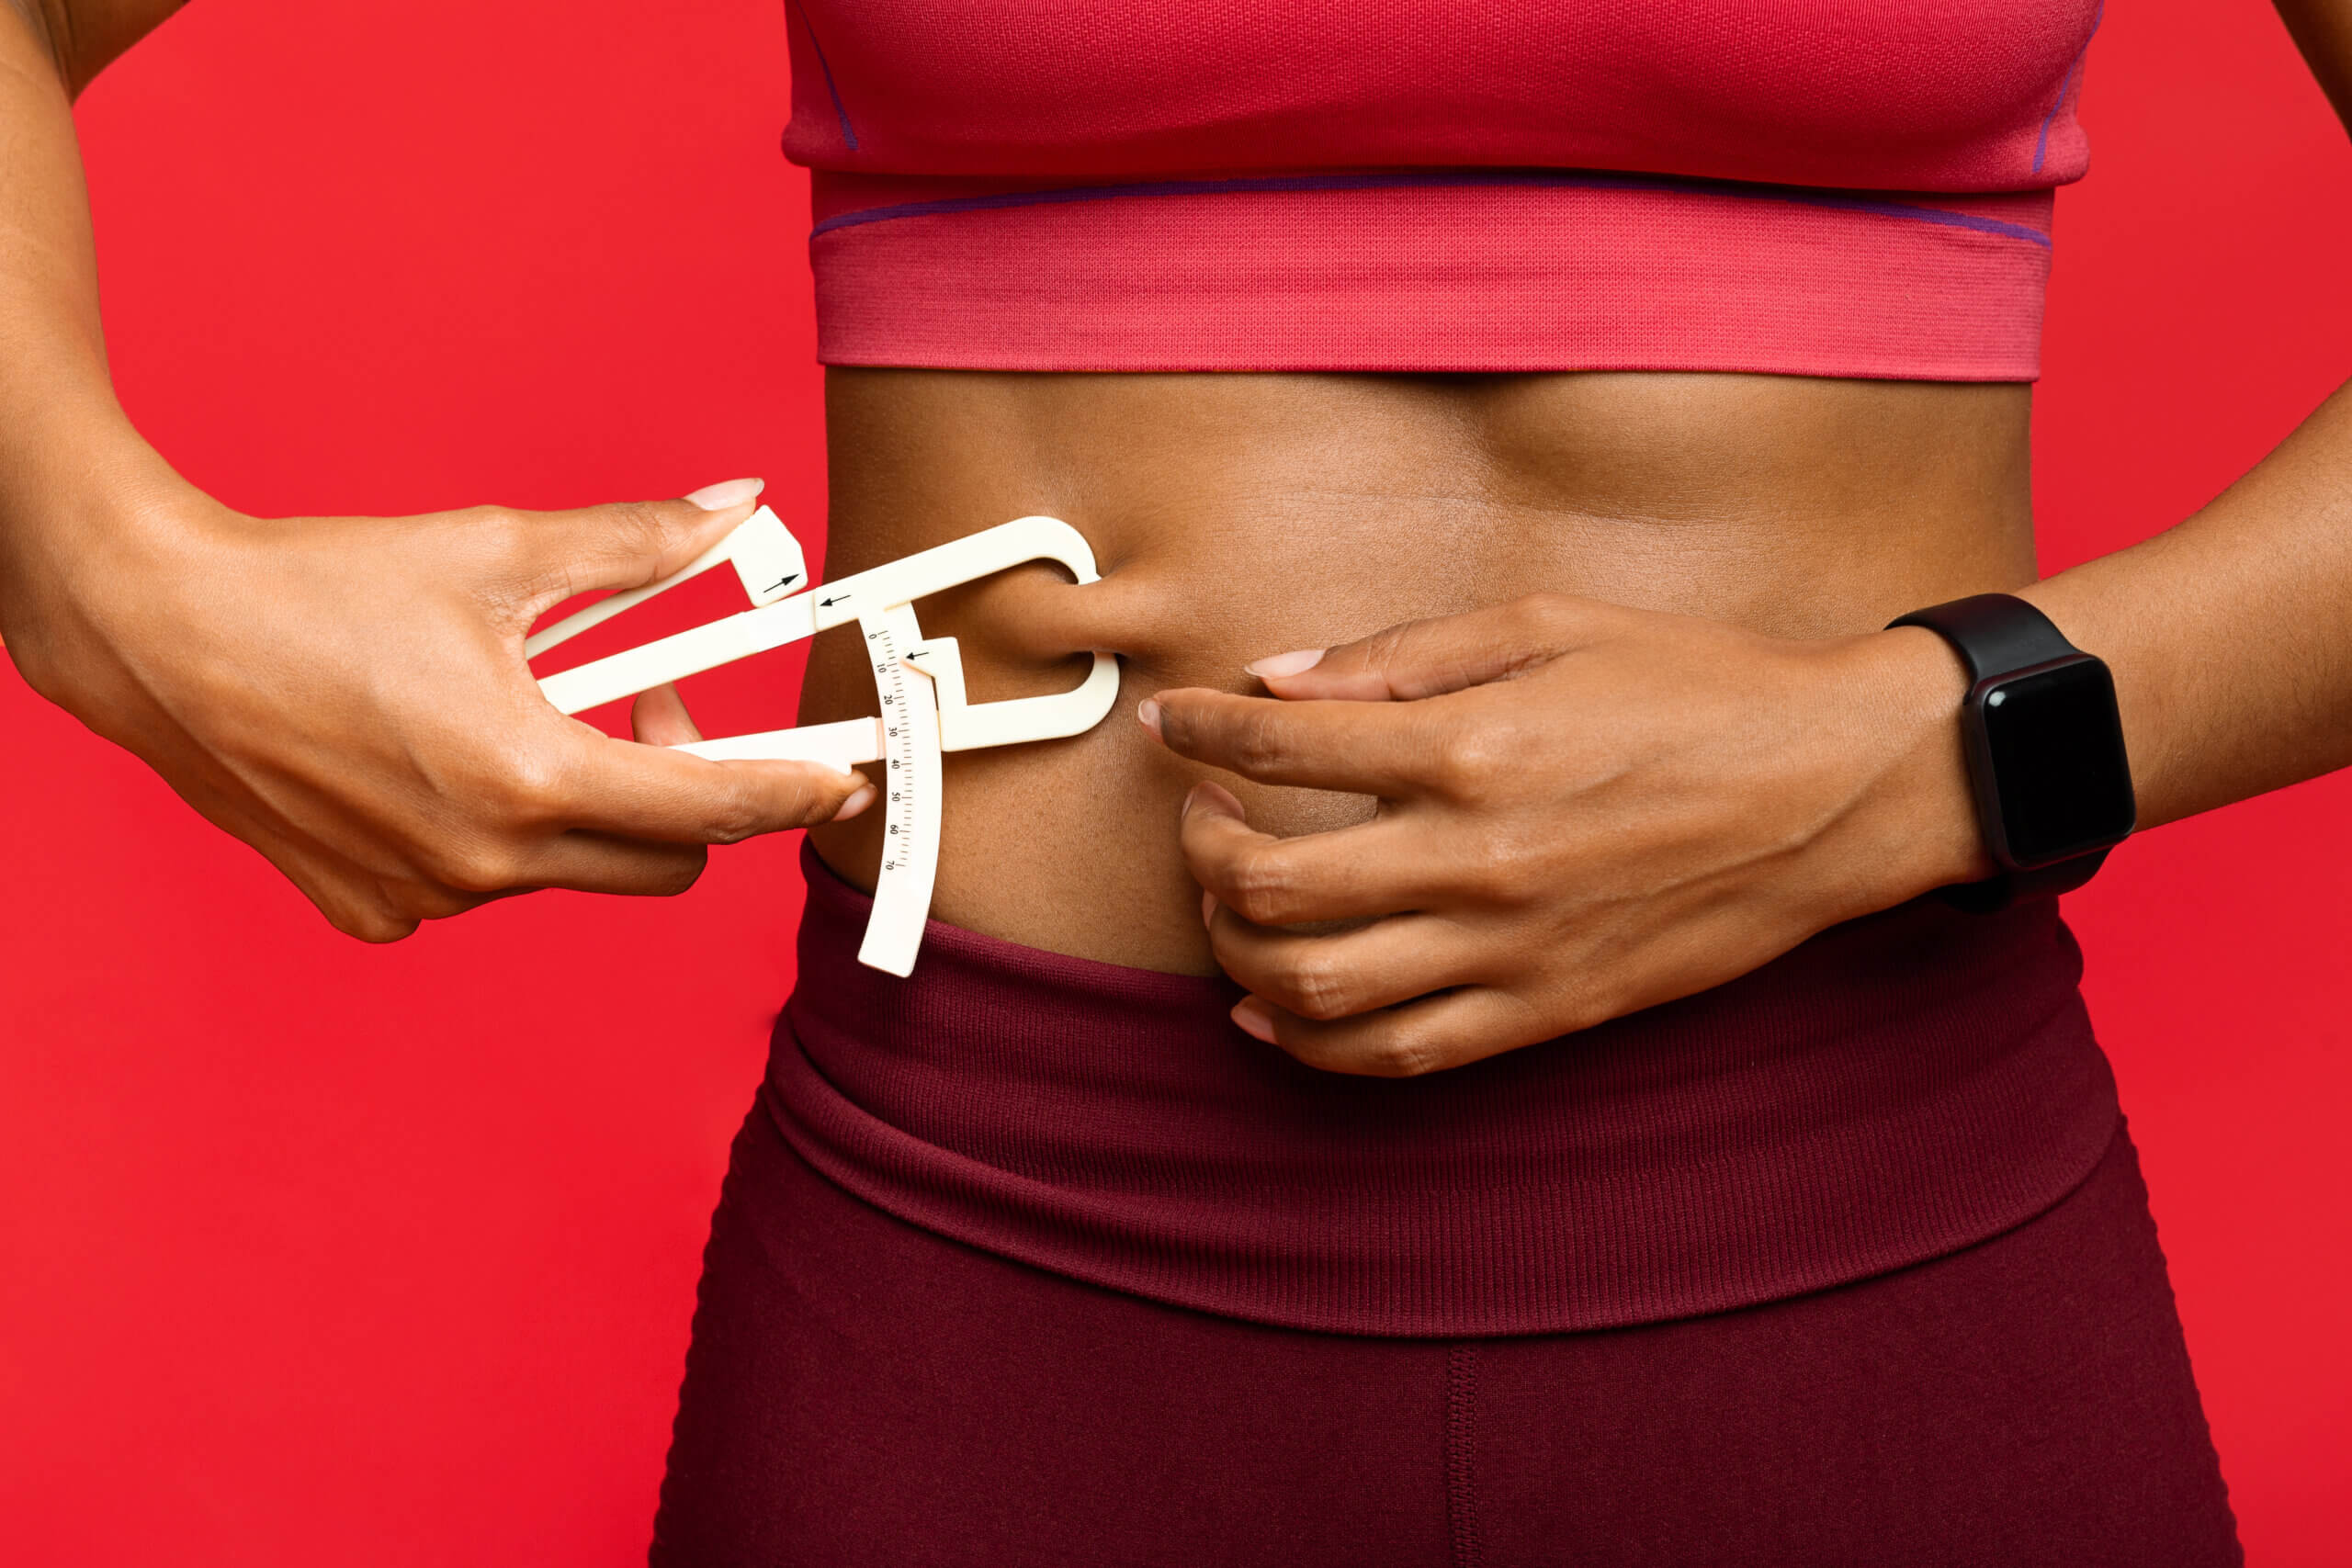
femal measuring body fat

Getting lean, especially if you’re starting with a higher body fat percentage, might feel like an uphill battle, but it doesn’t have to be. Incorporating simple, yet highly effective, habits can make all the difference. The key to success is consistency and finding strategies that fit into your daily life. Here are five underrated habits that will help you get lean faster.

1. The 15,000 Steps Rule

Walking is one of the most underrated forms of exercise, especially for fat loss. While it may seem too simple, research shows that walking primarily burns fat for energy, making it an efficient way to shed extra pounds. Unlike high-intensity exercises, walking is a low-impact activity that can be done daily without excessive wear and tear on your body.

A great starting point is 10,000 steps per day, but you should work up to 15,000 steps as you progress. You can easily incorporate more walking into your routine by making small changes—walk to the gym, take the stairs, or walk during phone calls. If you track your steps using a fitness app or wearable, you’ll be able to stay accountable. Walking not only promotes fat loss but also improves cardiovascular health and boosts mental clarity.

2. Prioritize Protein in Your Diet

When it comes to building muscle and losing fat, protein is king. Protein helps to keep you full, supports muscle repair, and even increases the number of calories your body burns during digestion. Including 30-50 grams of protein per meal will help ensure you stay on track while keeping hunger at bay.

A good formula to follow is eating protein-rich foods such as chicken, steak, fish, or plant-based options like tofu. To make it easier, you can plan out your meals with a focus on hitting your daily protein goals. A consistent intake of protein keeps you in a caloric deficit, essential for fat loss, while maintaining muscle mass.

3. Get Your Sleep In Check

If you’re not sleeping enough, you’re sabotaging your fat-loss efforts. Aim for 7-8 hours of quality sleep per night, as sleep is when your body repairs and recovers from the stresses of the day. During deep sleep, your body regulates crucial hormones like testosterone and growth hormone, which are essential for muscle growth and fat loss. A lack of sleep leads to increased cravings and poorer decision-making around food.

To optimize your sleep, create a consistent bedtime routine, avoid caffeine late in the day, and stop eating a few hours before bed. When you get enough rest, you’ll notice improved energy, motivation, and mental sharpness, all of which contribute to better fat-loss results.

4. Train in the Morning, Eat Later

Morning workouts can kick-start your day and provide a mental and physical boost that lasts for hours. Training early allows you to check off one of the most important tasks of the day while releasing endorphins that keep you energized and focused. Plus, it’s one less thing to worry about as the day progresses.

Pair this with intermittent fasting, where you save your calorie intake for later in the day, and you’ll find it easier to stick to your diet. You don’t need to follow a rigid fasting schedule—start by fasting for 12 hours and eating within a 12-hour window. Gradually extend the fasting period as you become more comfortable. This method allows you to focus on important tasks in the morning without feeling sluggish from a heavy breakfast and enables you to enjoy larger, more satisfying meals later in the day.

5. Plan and Track Your Meals

Busy schedules often lead to poor eating choices, but tracking your meals the day before can be a game changer. By pre-planning, you eliminate the guesswork, allowing you to stick to your nutrition goals with minimal stress. Consistency is key, and a great strategy is to track your meals once a week, then repeat the same meals for the week.

By reducing variability in your diet, you’ll better manage energy levels and avoid overeating. This approach simplifies meal prep and ensures you’re hitting your caloric and macronutrient goals without feeling overwhelmed.


By incorporating these five simple habits into your routine, you’ll not only make the process of getting lean easier but also more sustainable in the long run. Focus on these underrated strategies, stay consistent, and watch the transformation unfold. Whether you’re just starting out or looking to break through a plateau, these habits are the foundation for long-term success.

Unlocking the Secrets to Accurate Resting Metabolic Rate Calculations for Bulking and Cutting Success

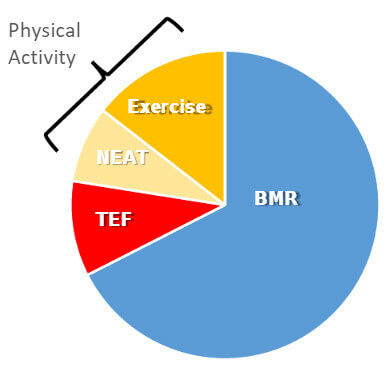
An informative TDEE (Total Daily Energy Expenditure) chart illustrating the relationship between calorie intake, activity levels, and weight changes, helping users understand how to adjust their diet and exercise plans for optimal results

Limitations of Common Resting Metabolic Rate Equations

In a recent article titled “Most metabolic rate prediction equations are bad when weight is stable, and worse when it isn’t,” Eric Trexler discusses the limitations of common resting metabolic rate equations in predicting energy expenditure during bulking. The article explains that many online calorie calculators use validated equations to predict resting metabolic rates based on basic information like age, sex, weight, and body fat percentage. However, fat-free mass or lean body mass is the most reliable predictor of energy expenditure, and total daily energy expenditure varies significantly even for people with the same amount of fat-free mass.

The Validity of Resting Metabolic Rate Prediction Equations

Trexler highlights a study by Rodriguez et al., which investigates the validity of several commonly used prediction equations to track resting metabolic rate changes during a hypercaloric nutritional intervention and supervised resistance exercise training program. The results showed that all the equations underestimated the change in resting metabolic rate, with some almost missing the increase entirely. The article emphasizes that the mistakes made by these equations increase even more when attempting to transform resting metabolic rate into total energy expenditure to pinpoint calorie intake objectives.

An Empirically-Driven Approach to Caloric Intake Targets

Trexler suggests that the best approach for determining an individual’s calorie target while bulking or cutting is to rely on empirical, individualized observations, such as accurately tracking daily body weight and energy intake to identify the required calorie target to meet weight loss, weight gain, or weight maintenance goals. Predictive equations for resting metabolic rate are not entirely useless, but their utility is limited. They can sometimes be used as a starting point for determining caloric intake targets, but once weight changes occur, an empirically-driven approach is recommended. This method helps create a truly individualized calorie target that can be adjusted as energy expenditure increases during bulking and decreases during cutting.

My Perspective

The Importance of Resting Metabolic Rate Testing

In my view, one way to enhance the accuracy of determining an individual’s metabolic rate is by utilizing an actual Resting Metabolic Rate (RMR) Test, if available. An RMR test measures an individual’s resting metabolic rate by assessing the amount of oxygen consumed and carbon dioxide produced. This direct measurement provides a personalized, accurate baseline for caloric needs, which can be valuable when planning a diet or exercise regimen. RMR tests can be performed in specialized clinics or fitness centers using advanced equipment, such as indirect calorimetry devices.

Retesting RMR During Significant Changes in Body Composition

It’s essential to consider retesting your RMR during significant changes in body composition. A significant change might involve a weight loss or gain of approximately 5% or more of your initial body weight. Retesting RMR after such changes allows you to adapt your nutritional plan and physical activity to your current metabolic rate, ensuring optimal progress and health.

The Importance of Weekly Check-Ins

In addition to RMR testing, the importance of weekly check-ins cannot be understated. Consistent monitoring of body weight, energy intake, and overall progress helps to fine-tune your caloric intake and exercise plan. This allows adjustments to be made as needed, leading to better adherence to your goals and a more individualized approach.

Conclusion

In conclusion, while resting metabolic rate equations can provide a starting point for determining caloric intake, an actual RMR test and weekly check-ins are essential for more accurate, individualized results. By utilizing an empirically-driven approach to caloric intake targets, incorporating RMR testing during significant changes in body composition, and consistent weekly check-ins, you can optimize your progress, better understand your body’s unique metabolic needs, and maintain a sustainable and healthy lifestyle. It’s important to note that significant changes in body composition, such as a weight loss or gain of approximately 5% or more of your initial body weight, should be considered when retesting RMR and adjusting your nutritional and exercise plans accordingly.

Optimizing resting metabolic rate calculations for bulking and cutting success involves taking an individualized, empirical approach to caloric intake targets and utilizing tools such as RMR testing and weekly check-ins to fine-tune your progress. With dedication and persistence, you can achieve your health and fitness goals effectively and sustainably.

FAQs

Q1: What does RMR stand for?

A1: RMR stands for Resting Metabolic Rate.


Q2: What does BMR stand for?

A2: BMR stands for Basal Metabolic Rate.


Q3: What is the difference between RMR and BMR?

A3: The main difference between RMR and BMR is that RMR is measured under more relaxed conditions than BMR. RMR is measured after the subject has fasted for several hours, while BMR is measured after a full night’s sleep and 12 hours of fasting.


Q4: Why is it important to know your RMR or BMR?

A4: Knowing your RMR or BMR is important because it helps you understand how many calories your body burns at rest. This information can be useful for weight management, as it can help you determine how many calories you need to consume or burn to achieve your weight goals.


Q5: Can RMR and BMR be increased?

A5: Yes, RMR and BMR can be increased through various methods, such as increasing muscle mass, engaging in physical activity, and consuming certain foods or supplements. However, the extent to which these methods can increase RMR and BMR varies from person to person.


Q6: What is Resting Metabolic Rate (RMR) testing?

A6: Resting Metabolic Rate (RMR) testing directly measures an individual’s resting metabolic rate by assessing the amount of oxygen consumed and carbon dioxide produced. It provides a personalized, accurate baseline for caloric needs, which can be valuable when planning a diet or exercise regimen.


Q7: What is the significance of RMR testing?

A7: RMR testing is significant because it accurately measures an individual’s metabolic rate, which is essential for determining caloric needs for weight management, and planning a personalized diet or exercise regimen.


Q8: How is RMR testing performed?

A8: RMR testing is performed by assessing the amount of oxygen consumed and carbon dioxide produced through indirect calorimetry devices in specialized clinics or fitness centers.


Q9: Can RMR testing be performed at home?

A9: RMR testing cannot be performed at home, as it requires specialized equipment such as indirect calorimetry devices that are typically only available in specialized clinics or fitness centers.


Q10: Who can benefit from RMR testing?

A10: Anyone who is interested in accurately determining their metabolic rate and planning a personalized diet or exercise regimen can benefit from RMR testing. Additionally, individuals looking to manage their weight or improve their overall health and wellness can also benefit from RMR testing.


Q11: What is the most reliable predictor of energy expenditure?

A11: The most reliable predictor of energy expenditure is fat-free or lean body mass, as total daily energy expenditure varies significantly even for people with the same amount of fat-free mass.


Q12: What do many online calorie calculators use to predict resting metabolic rates?

A12: Many online calorie calculators use validated equations to predict resting metabolic rates based on basic information like age, sex, weight, and body fat percentage.


Q13: What are the limitations of standard resting metabolic rate equations?

A13: The limitations of standard resting metabolic rate equations include that they are unreliable predictors of energy expenditure during bulking and that total daily energy expenditure can vary significantly even for people with the same fat-free mass.

The Future of Fitness: Exploring Nutrition and Body Composition Analysis with Technology

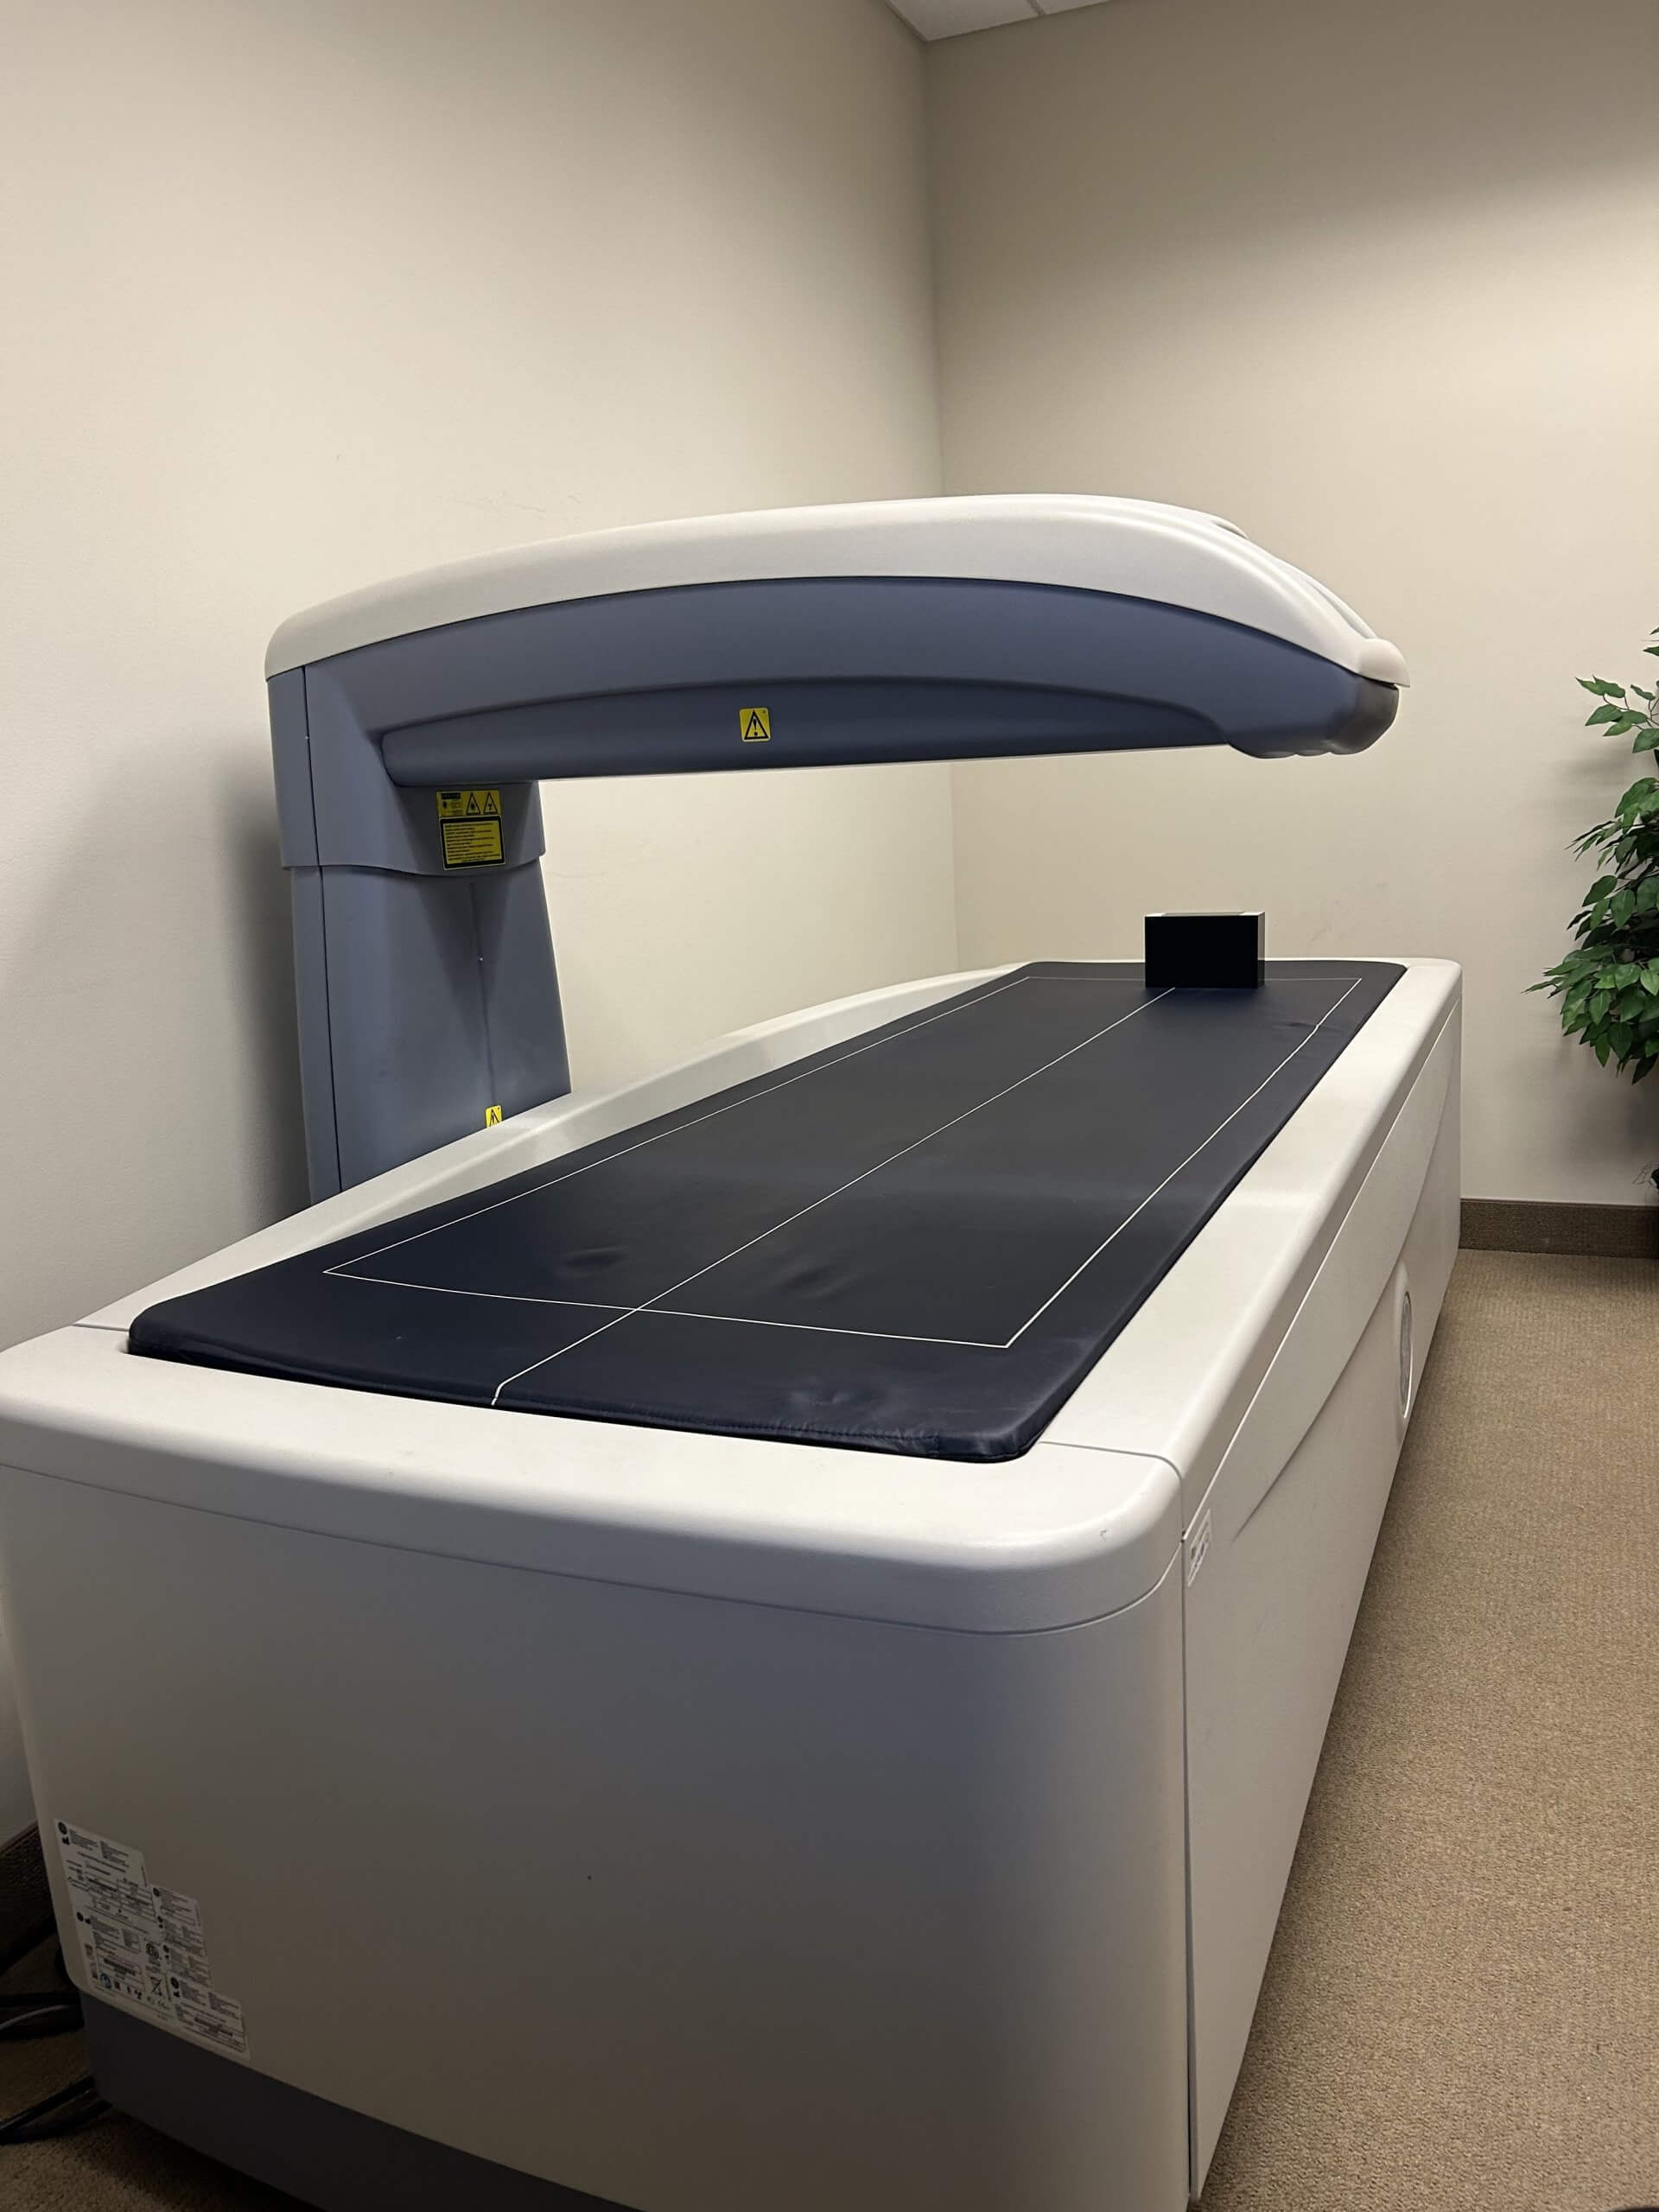
A DEXA table used for body composition analysis

The Naked Truth About Body Composition

Don’t Worry, You Can Keep Your Clothes On

Welcome to the world of body composition analysis, where numbers and percentages reign supreme. If you’ve ever wondered about the makeup of your body beyond just weight, then you’re in the right place. Whether a fitness enthusiast or a health professional, understanding your composition is crucial to achieving your health and fitness goals.

The Skinny on Body Composition Analysis

Body composition analysis determines the relative amounts of components that make up the human body, such as fat, muscle, bone, and water. This type of analysis can provide valuable information about an individual’s health status and is becoming increasingly popular in the world of health and fitness.

This blog will explore the techniques and technologies used to measure body composition, focusing on the current gold-standard methods. We’ll also take a closer look at the role of this analysis in nutrition and answer some common questions about this fascinating field. So, let’s dive in and uncover the naked truth about body composition analysis!

What is Body Composition Analysis?

Definition of Body Composition

Body composition refers to the relative proportion of tissues that make up the body, such as fat, lean body mass, organs, bone, and total body water. Understanding is essential because it can provide insights into an individual’s health, fitness, and health risks for chronic diseases.

Importance of Measuring Body Composition

Measuring body composition is vital for many reasons. For example, individuals who are overweight or obese may have a higher percentage of body fat mass and a low amount of fat free body mass, which can increase the risk for conditions such as heart disease, diabetes, and certain types of cancer. Conversely, underweight individuals may have a lower percentage of muscle mass, which can affect their strength, mobility, and overall quality of life.

Techniques for Body Composition Analysis

There are several techniques for analyzing body composition, each with its strengths and weaknesses. Here are some of the most common methods:

  1. Dual Energy X-ray Absorptiometry (DEXA): DEXA is considered the gold-standard method for measuring body composition. It uses a low-dose x-ray to accurately measure the density of different tissues in the human body, including bone, body fat, and muscle. DEXA is highly accurate and can provide detailed information about where fat and visceral fat is distributed throughout the body.
  2. Air Displacement Plethysmography (ADP): ADP, also known as the BodPod test, measures body composition by calculating the amount of air displaced by the body. This method is highly accurate and is often used in research settings.
  3. Bioelectrical Impedance Analysis (BIA): BIA measures body composition by sending a small electric current through the body and measuring how easily the current flows through different tissues. BIA is non-invasive and relatively inexpensive, but it may not be as accurate as other methods. Most popular scales and Inbody Technology use bioelectrical impedance analysis
  4. Skinfold Thickness Measurements: This method involves using calipers to measure the thickness of skinfolds at various points on the body. Body fat measurements can be used to estimate body fat percentage, but the accuracy of this method can vary depending on the technician’s skill in conducting a body composition test.
  5. Hydrostatic Weighing: Hydrostatic weighing, also known as underwater weighing, measures body density by weighing an individual on land and then again while submerged in water. This method can be highly accurate but uncomfortable and impractical for some individuals.

It’s important to note that no single method is perfect, and each has its limitations. Combining techniques may provide a more comprehensive assessment of an individual’s body composition.

Body Composition Analysis in Nutrition

Importance of Body Composition Analysis in Nutrition

Body composition analysis is an essential tool in the field of nutrition. It helps to determine a person’s overall health and risk for developing chronic diseases. In addition, body composition analysis is essential in identifying the type of mass a person carries and the amount of muscle, fat, and bone in their body.

Relationship Between Body Composition and Nutrition

Body composition and nutrition are intimately connected. For example, someone with a high percentage of body fat may be at a higher risk for developing cardiovascular disease, type 2 diabetes, and other chronic conditions. On the other hand, someone with a high percentage of muscle mass may have a faster metabolism and be able to burn more calories at rest.

Using Body Composition Analysis to Personalize Nutrition Plans

Body composition analysis allows nutritionists to personalize nutrition plans for their clients based on their unique body composition. By understanding a person’s body composition, a nutritionist can tailor their recommendations to help them achieve their goals: losing weight, gaining muscle mass, or improving overall.

Importance of determining daily caloric needs

Knowing our daily caloric needs is essential to maintaining a healthy weight and achieving our fitness goals. It is the foundation of a successful diet plan and weight management strategy. Daily caloric needs refer to how many calories an individual needs to consume daily to maintain their current weight. If you consume more calories than your daily requirement, you will gain; if you consume fewer calories, you will lose. Thus, determining your daily caloric needs is crucial to achieving your body weight goals.

Advantages of using technology for calculating daily caloric needs

Technology has made it easier to calculate daily caloric needs. Gone are the days when one had to rely on a complicated formula to determine how many calories one should consume daily. Nowadays, several mobile applications and websites can help determine the total calories an individual needs based on age, gender, height, weight, and physical activity level. The use of technology has made it easier and more accurate to determine daily caloric needs, which can result in more effective weight management strategies.

Wearable devices are becoming increasingly popular as a tool to track daily caloric needs. These devices, worn on the body, are designed to monitor physical activity, sleep, and other daily metrics. Using various sensors and algorithms, wearable devices track different types of physical activity, such as steps taken, distance covered, and calories burned. Some devices also monitor heart rate, sleep patterns, and other metrics to estimate a person’s daily caloric needs based on age, gender, weight, and activity level.

Some popular examples of wearable devices for tracking calories include the Fitbit, Apple Watch, Garmin, and Oura. The Fitbit is designed to be worn on the wrist and tracks steps taken, calories burned, and other metrics. The Apple Watch includes various health and fitness features, such as a heart rate monitor, GPS tracking, and tracking calories burned during different activities. Garmin offers a range of wearable devices for monitoring physical activity, including GPS watches and fitness trackers, while Oura focuses on tracking sleep and recovery metrics.

Wearable devices can be a convenient and easy-to-use tool for tracking physical activity and estimating daily caloric needs. They provide real-time feedback on physical activity and calorie intake and can help motivate people to be more active and make healthier choices. However, wearable devices can be expensive to purchase and maintain, may not be accurate in all situations, and rely on self-reporting of food intake, which may not always be accurate. Considering the potential pros and cons before investing in one of these devices is crucial.

Testing with Professional Services.

Professional services that use technology to calculate daily caloric needs are another option for those who prefer a more personalized approach. These services typically involve a consultation with a nutritionist or dietitian who will use various measurements and assessments to determine an individual’s caloric needs. Some examples of professional services that use technology for this purpose include metabolic testing, indirect calorimetry, and RMR (resting metabolic rate) testing. The advantage of using these services is that they can provide a more accurate and personalized assessment of an individual’s caloric needs. However, the cost and accessibility of these services may be a barrier for some individuals.

In conclusion, body composition analysis is crucial in achieving health and fitness goals. The gold-standard methods for body analysis, such as DEXA and ADP, accurately measure and provide valuable information about an individual’s overall health. Combining techniques may provide a more comprehensive assessment culminating in the desired body composition results. Nutritionists can use body composition analysis to personalize nutrition plans for their clients, tailoring recommendations to help them achieve their weight goals. Determining daily caloric needs is essential for maintaining a healthy weight, and technology has made it easier and more accurate to calculate. Wearable devices are increasingly popular for tracking daily caloric needs, monitoring physical activity levels, and providing valuable feedback. Overall, with the help of technology and body composition analysis, individuals can achieve their health and fitness goals with greater accuracy and efficiency.

Race Report – Hampton Roads Shootout – Daniel Shumacher

This weekend, I raced the 2019 Hampton Roads Shootout (Conquer the Canal Time Trial + Langley Speedway Criterium) as a tuneup for the 2019 MABRA Mid Atlantic Time Trial Series which starts in late May with the Argyle Time Trial. Two weeks ago I did a dress rehearsal of my logistics, Warmup, Training, Equipment following the end of the Naval Academy Road Race and TT.

Saturday – CCTT

This race is located south of Chesapeake in the Great Dismal Swamp and parallels US 17. It is a 12.3 mile out and back along a former road turned into a bike trail. It is very flat with 75% of the route being in woods although there is a little bit next to an open field near the turn.

I woke late but managed to get out of the door on time and most of the stuff was already in the car. It had rained overnight and the closer I got to the starting location the heavier the rain. Just walking the 15 feet from the car to the men’s room got me soaked. After checking in and waiting about 10-15 mins to see if the rain would stop I decided to find a dry location where I could warm up. I had remembered a strip mall just north and checked google for churches and schools as locations. There was a school nearby which had a large awning which served my purposes perfectly and I pulled the whole car out of the rain.

After getting everything squared I was able to do the whole warmup although I had to chop it down by 10 mins. After relocating back to the start I did all my final checks and got my bike, disc, and equipment set up. I had run BBS the night before and it was projecting I should maintain 253 Watts for the whole event. After talking with my coach the plan was adjusted to Quarter the route and maintain 245, 250, 250, 265/all out watts for each section. I had two rabbits in front of me and caught both of them well before the halfway mark (they were both on normal road bikes). I was caught by the guy who started a minute behind me just before the turn and we exchanged leads a couple of times before and after the turnaround before I really went ahead and put in a dig in order to get some separation because watching his pedaling technique and body movement I knew he had burned a lot of matches trying to get me on the outbound while I had been holding back and riding conservatively on the first half and was trying to “ride my race”.

I was able to get separation and probably clawed back about 30 seconds or so on him by the end of the course. Then I was passed by a second guy who put in an insane effort to win with a 26:37. I was disappointed to see the race ride away but it was such a great effort I couldn’t help but say “chapeau”. I just put my head down and try to finish as fast as possible and set a 5 min power PR and several heart rate PRs as well all firmly in tempo. When I saw the results, 5th, I was livid. Even though the purpose was to get real TT results in order to build for future races the execution was great, I still felt like I finished with gas in the tank.

Langley Speedway Criterium

This is an oval track with some slight banking and we were racing in a counterclockwise direction. The laps were mostly under a minute and we were racing for 40 minutes. There has been a rain shower that morning which wet the track but the locals said it wasn’t enough to make it slick. I got there early and managed to get the full crit warmup finished while watching a trucking school teach new student drivers. Somehow registration had given me the wrong number but we were able to get everything squared with plenty of time to get wheels in the pit and laps done before the start.

This was a combined 4/5 race with two major local teams THR Racing (16) and Fat Frogs (3) and 7-8 singles. I came to TT and signed on to the crit as a bit of an afterthought with no expectations other than pushing myself hard, have fun and finish upright. My goal was just to sit in the group and try to avoid working as much as possible while fishing with the front group since I expected this to be a typical cat 4/5 race. THR was pretty active in this race but they weren’t able to keep the attacks coming. It would string out for a lap or two but then eventually it would come back together. It did take a couple of laps for people to begin getting shed. It was a major problem because the refs were not pulling lapped riders or telling them to stick to the outside of the track. I really don’t see how they were able to keep everything straight. Just tried to follow every attack as much as possible and not get gapped.

There was one situation where we had a 5 person break up the road where I did do a pull but they did get caught and another where I had to burn a match to blow past a group in order to get up to the front. Starting out I was trying to stay on the outside of the track but on the last couple of laps I moved inside and on the final lap the sprint went to the outside rather than the inside. Didn’t really get a good sprint because I was pretty well blocked in the end of the race.

The Silver Lining

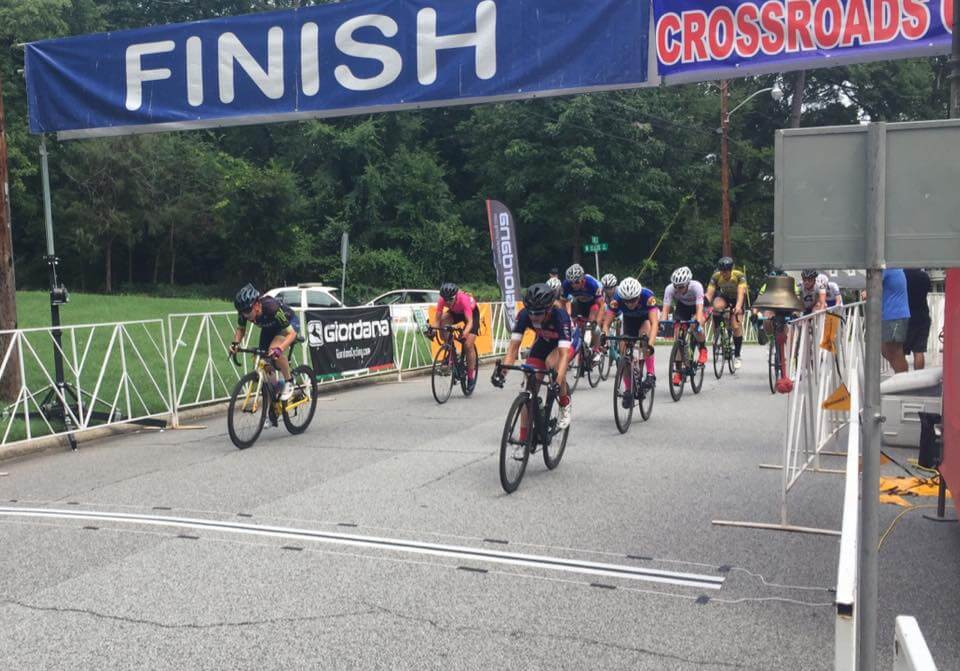
Overall I was happy with the performance and I was able to close the gaps when they opened and I finished on the front of the race. I had the fitness to ride with the group and think tactically even though I tried to set in. My buddy rode over to watch but ended up missing the race and while we were watching the next race (where Keith Johnson destroyed the field) I noticed they were calling my name out. Wandered over to registration to check placing (11th) and asked one of the officials why they were calling my name. Turns out there was an “overall category” for the “shootout” and based on my TT and crit performance I was able to win the Cat 5 overall for the two races. It had been a tie but the break was TT performance. I was really stoked because this was a silver lining I had not anticipated it was really cool to get the first “win” following a long hard winter in the gym and many cold miles on the trainer and the road.

Online Store is Open

We are excited to announce our Online Store is open. Check the menu for Shop and get all of the latest KyleCoaching Kits and Apparel.

BMI, Percentage Body Fat, and w/kg. What gives?

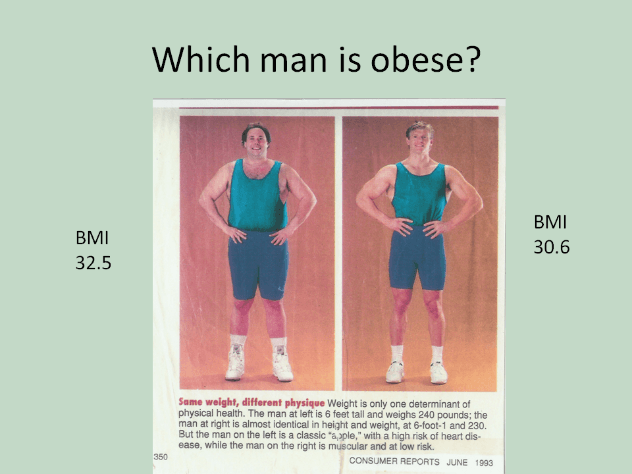
Obese?

When it comes to body composition, people use many different phrases. Many of these terms are misunderstood and used incorrectly. A client once said his BMI was 22% and he wanted to get it down to 10%. He said BMI but meant body fat percentage. This article sifts through the terminology, provides a proper definition of each, and applies it to weight loss, body composition, and cycling.

What does each mean?

In the early 19th century, a Belgian mathematician, Lambert Adolphe Jacques Quetelet, came up with a formula that showed “the weight increases as the square of the height (Eknoyan 2008)”. Ancel Keys renamed this formula the Body Mass Index in 1972. In 1985, the U.S. National Institutes of Health popularized the index to classify obesity. BMI puts all individuals into one of four categories: “underweight,” “normal,” “overweight,” or “obese.” The measure does not take into account the distribution of body fat or distinguish between lean and fatty mass (Singer-Vine 2009). This ratio between height and weight is merely that, a ratio. It is not a person’s percentage of body fat. As an example, a BMI greater than 30 is considered obese. Therefore, both men in the picture are considered obese by BMI standards.

Obese?
According to BMI standards, they are both obese regardless of body composition.

Unlike BMI, body fat percentage (BFP) is the total mass of fat divided by the full body mass, multiplied by 100. Body fat includes essential body fat and storage body fat (Body Fat Percentage n.d.). Body fat percentage is a measure of fitness level because it is the only body measurement that directly calculates a person’s relative body composition. It is independent of height and weight. In Racing Weight, Matt Fitzgerald states the average body fat for a professional cyclist is 6-11% for men and 12-16% for women. (Fitzgerald, Racing Weight: How to get lean for peak performance 2012). While body composition is an excellent predictor of performance at all levels of cycling (Fitzgerald, Why Are Leaner Athletes Faster? 2018), it does not guarantee a place on the podium.

The last measurement that we discuss is the power to weight ratio or watts per kilogram (w/kg). Dr. Andrew Coggan compiled some common power-to-weight ratios for professional, amateur, and recreational cyclists. This data helps determine what an athlete will likely need to achieve to be competitive with athletes at the same level. For instance, an amateur category 3 male cyclist must produce approximately 3.73 watts per kilogram for his FTP (Functional Threshold Power) to be competitive with another category 3 cyclist. Power to weight ratio is an excellent way of comparing apples to apples across cycling disciplines and categories.

Why does this matter?

A balance exists between body composition and watts per kilogram. There is a point at which too much weight loss can negatively impact an athlete’s power output. Additionally, too much lean body mass which increases body weight will decrease the power-to-weight ratio if that extra muscle does not generate more power. To solve this problem, you need to determine the optimal body fat percentage and corresponding body weight which yields the highest power-to-weight ratio. How to begin? Start with a smart scale which measures body composition. Determine your ideal race weight. (A good calculator: http://www.racingweight.com/rwe/index.html#/). Then using strength training, cardiovascular training, and proper diet and work toward that goal.


References
“Body Fat Percentage.” Wikipedia. n.d. https://en.wikipedia.org/wiki/Body_fat_percentage (accessed December 2, 2018).

Eknoyan, Garabed. “Adolphe Quetelet (1796–1874)—the average man and indices of obesity.” Nephrology Dialysis Transplantation 23, no. 1 (January 2008): 47-51.

Fitzgerald, Matt. Racing Weight: How to get lean for peak performance. Boulder: Velopress, 2012.
—. “Why Are Leaner Athletes Faster?” Competition Running. November 5, 2018. https://running.competitor.com/2018/11/nutrition/why-are-leaner-athletes-faster_175805 (accessed December 2, 2018).

Singer-Vine, Jeremy. Beyond BMI: Why doctors won’t stop using an outdated measure for obesity. July 20, 2009. http://primary.slate.com/articles/health_and_science/science/2009/07/beyond_bmi.html (accessed December 1, 2018).

Add a Quarq powermeter to your track bike? Yes you can.


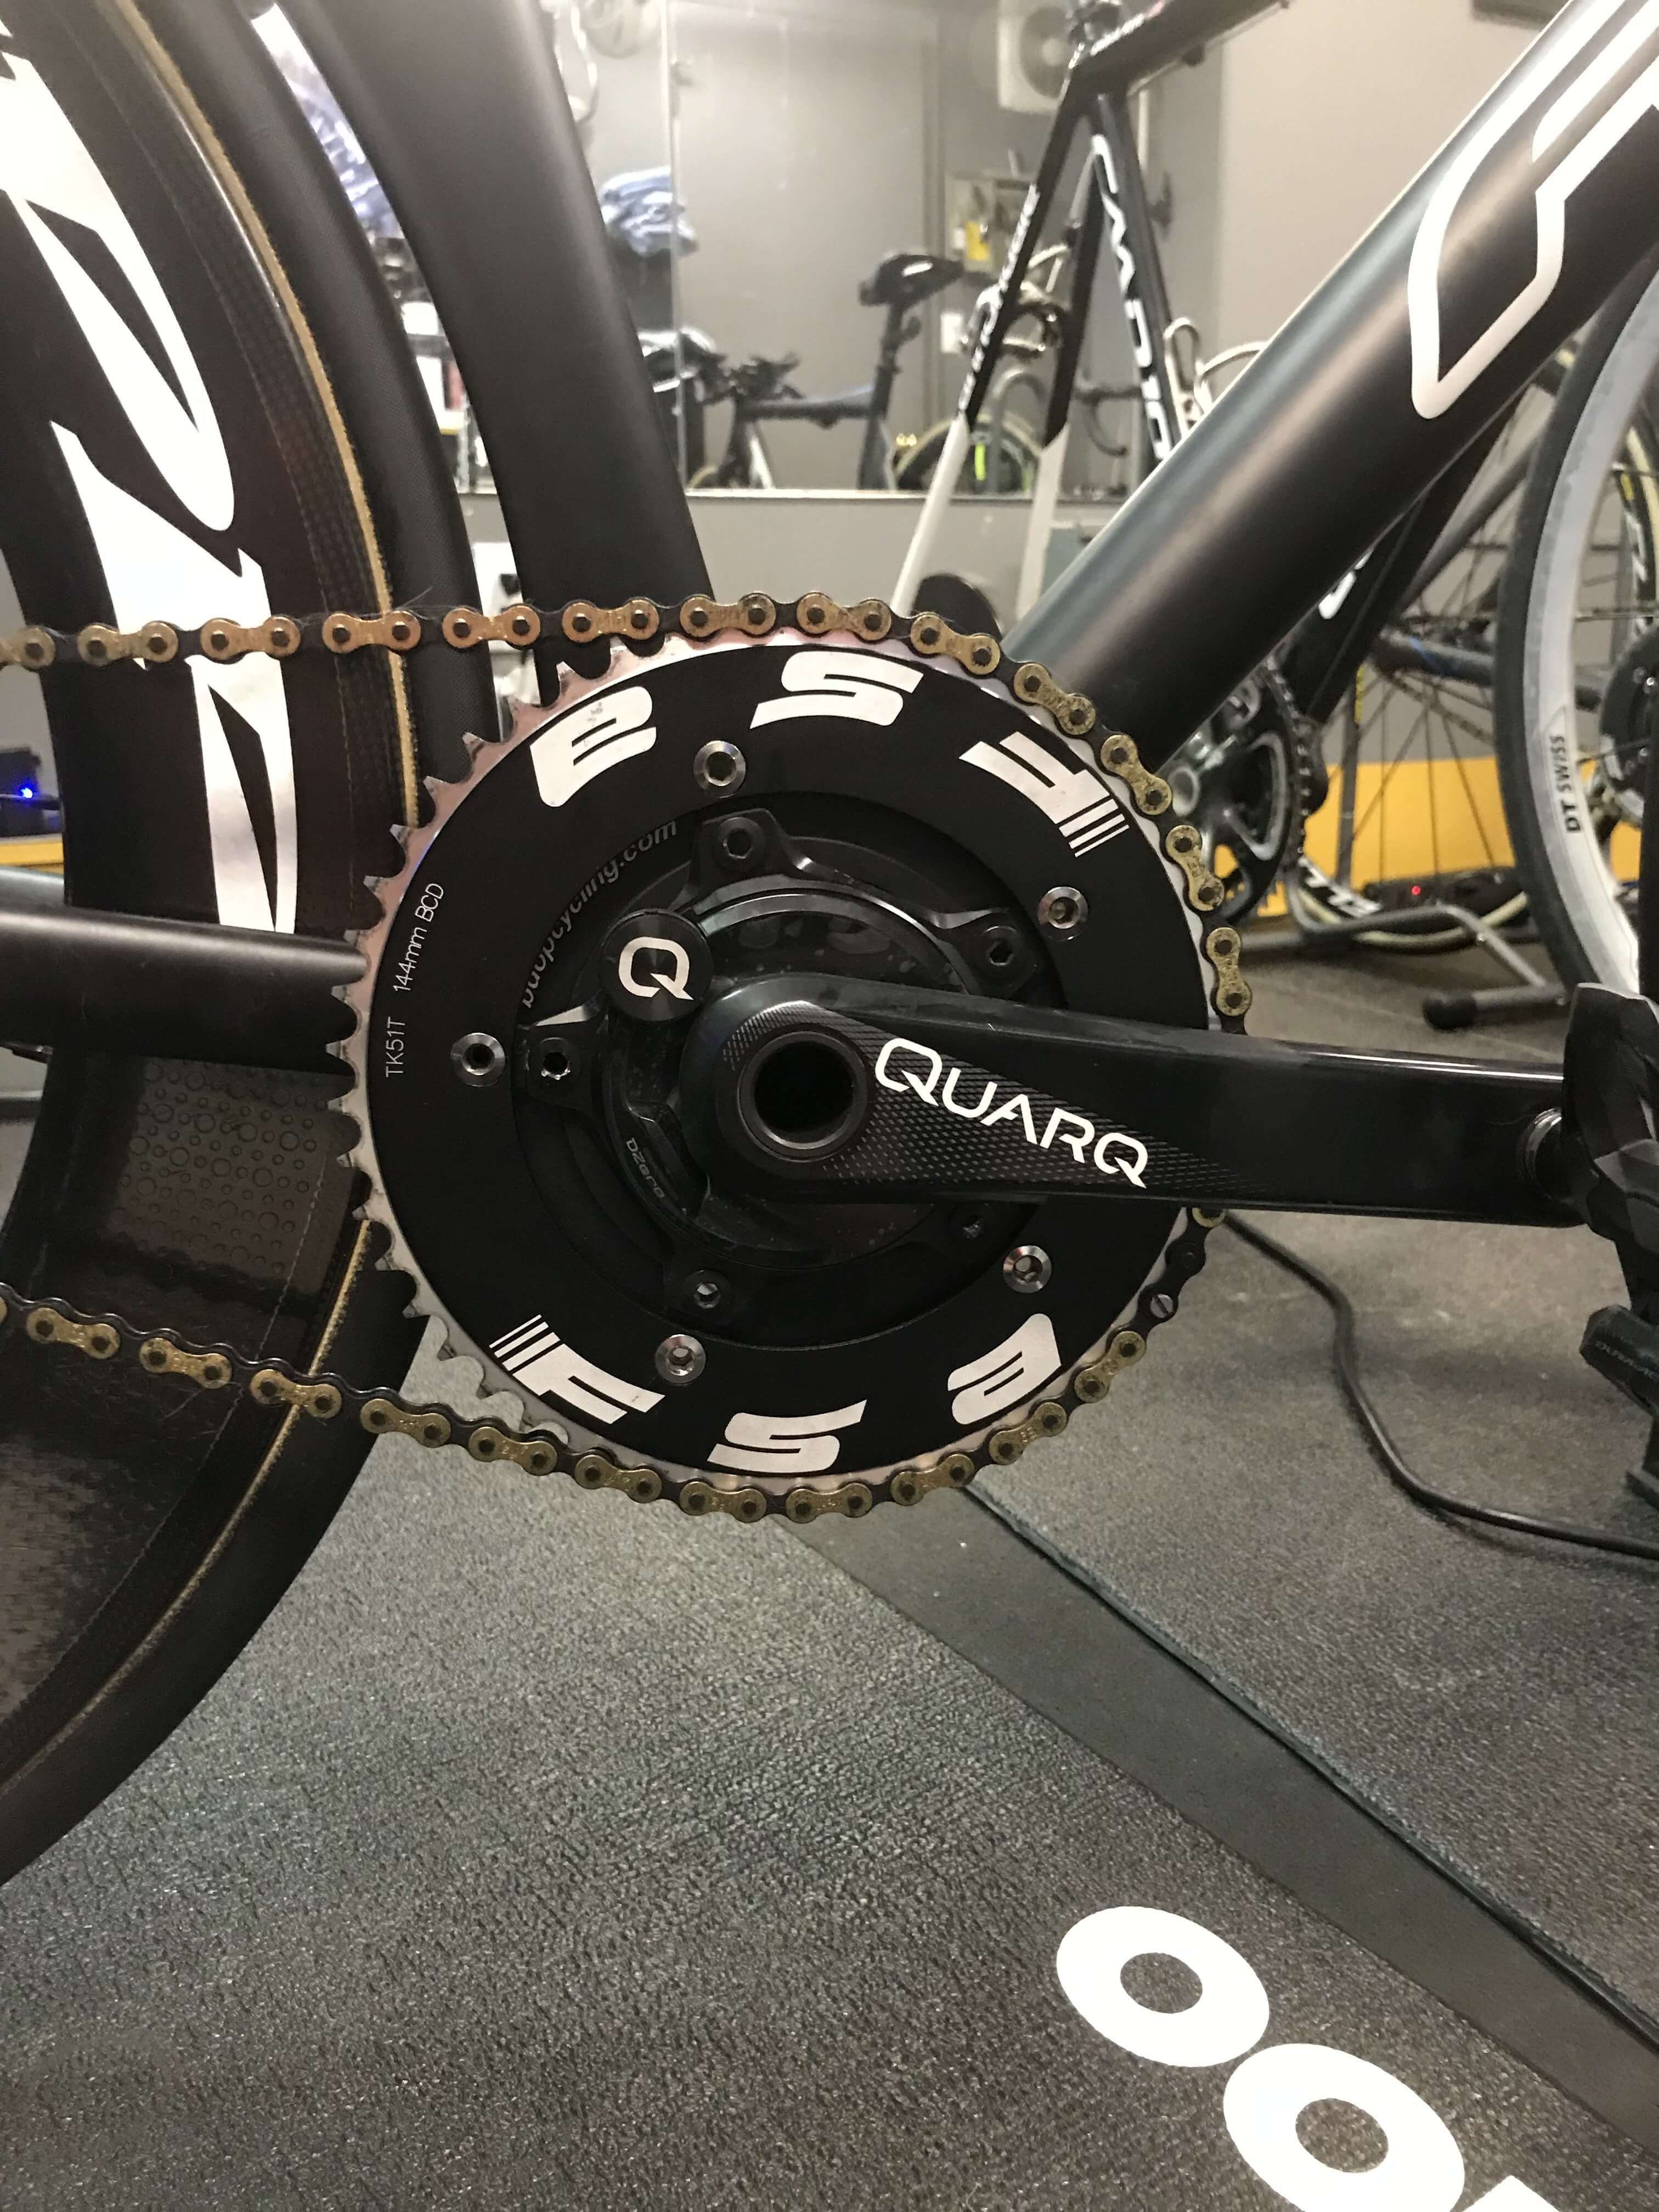
Sweet Quarq Powermeter setup
My new Quarq powermeter on my Felt Track bike

After the first day at the track, you will quickly learn that there is a whole new cycling vernacular. Are you running a 94″ gear, do you warm up with an 88”? Those numbers are terms just about the bike, never mind the stayer’s line, rail, and others. Being a roadie, I wanted to do roadie training. I wanted to know how to add a powermeter to my track bike.


Getting together the parts

The first thing about the track bike is that it does not run a standard 110 or 130 BCD spider, it’s a 144. Since I am a big fan of Quarq, I went to their website to find out which Quarq powermeter is track compatible. The answer, all of them, sort of.

Back to the BCD. Yes, you can get an array of 110 and 130 BDC chainrings but nothing like the 144 BCD chainrings. You could use a 110 BDC and have a few chainrings, but the selection of 144 is much greater. Quarq only has 110 / 130 BCD powermeters. SRM has a dedicated 144 BCD Track Cycling Powermeter, but again, my preference is Quarq.

After a phone call to Quarq in Spearfish, South Dakota, I learned about an adaptor sold by a 3rd party.  The 3rd party adaptor converts a 110 to a 144 BCD. After a little research, I found the BDop Cycling 110 BCD to 144 BCD Track Adaptor for $69.99 plus shipping. I ordered two and waited, but not long. The adaptors left China on DHL and were here in Virginia in 4 days.  The shipping was a bargain, only $15. With my Quarq 110 DZero in hand and the BDop Cycling adaptor, I went to work.

Trial and Error

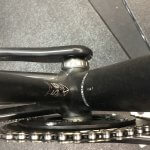
All the items put together snuggle
Quarq, adaptor, chainrings, nice and secure

My first “glitch” was the proper size chainring bolts. Remember you are going to put the adaptor on the powermeter, so you need to have an additional five chainring bolts. On the 56 Felt FK2, I used the SRAM chainring bolts without any issues.  On the 51 Felt, I used the Sugino 75 knurled track chainring bolts to secure the adaptor to the Quarq. Then I needed another five to secure the Chainring to the adaptor. Adding these bolts was a little more difficult, because of the thickness off the chainring and adaptor, did not allow the 5mm bolts for enough thread to secure the back. I needed a set of 8mm chainring bolts which Sugino makes.

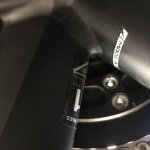
Getting them to fit was a little bit of a challenge.
Countersunk side to clear the frame on the 51 Felt

The first attempt at mounting the adaptors, I followed the instructions on BDops website. The video showed the adaptor mounted on the powermeter like a chainring and then the chainring on the adaptor.  The issue was the chainline measurement was a little off and the chain did not fall directly on the sprocket and chainring.  This resulted in an extremely loud drivetrain.  I stopped by two bike shops and neither had a solution.  After talking to a friend, Will Wong, I moved the adaptor inboard of the powermeter spider and then I mounted the chainring normally.  This worked fantastic on the 56 Felt.  I needed to do a little modification for the 51 Felt.  I had to flip the adaptor so that the countersunk facing was toward the bottom bracket so that the back of the chainrings bolts went into the adaptor to clear the frame.

With the adaptor on, powermeter in place, I went to the track to collect data. This setup worked great. After my laps around the track, I can get data beyond, speed, cadence, and speed. If you are looking to add a powermeter to a track bike, I would highly recommend the Quarq/Bdop solution.

RACE REPORT: 2018 USA CYCLING MASTERS ROAD NATIONAL CHAMPIONSHIPS – MICHELE DAMIANI

Michele showing off a little bling from Masters Nationals

With a late decision (meaning around the beginning of the 2018 road racing season, on the East Coast) I decided that I was going to accompany my teammates down to Georgia for the 2018 Masters National Championships.  While my fitness was there, my racing legs were not quite there.  So, I turned to KyleCoaching to help get me ready for Masters Nationals.  Was it a little too late to be able to accomplish a podium finish at Nationals?  After talking to Chuck, he acknowledged that my fitness was there and that we would have to work on building some of the other aspects of racing.  Chuck was confident that working together I would be able to reach my goal at Nationals.

Fast forward to Masters Nationals in Augusta, GA in mid-June.  The morning of the criterium, I saw my teammates leave the house, one by one, to go race and then cheer on each other.  My race was at 3:40pm and I decided to stay at home in the air conditioning, making sure I was rested, fueled and hydrated.  I hated sitting at the house with a stomach full of nerves, but I knew the Georgia heat would drain me.  Chuck agreed that this was the best thing I could do to prepare for my late day race.

1:oopm came and it was time for me to head to the course.  I packed up my bike and gear and got on the road.  Upon arrival at the course, I found Chuck and Dana.  I continued to stretch and hydrate, as Chuck talked me through the course and we discussed strategy.  Chuck is extremely familiar with my strengths and weakness and was able to tell me exactly what I would need to do to make it on the podium.  Ok, it was time to warm up, so I took to the streets (warming up on a trainer would be unbearable).  I warmed up my legs, making sure I got some good efforts to wake up my legs.  Post warmup, I found Chuck and Dana near the starting line and Chuck gave me a few more words of encouragement and reminders about the course and what I needed to do to get on the podium.

I headed to the staging area where my teammate, Christine, was there to give me a little more motivation and cheered me on to my first ever Masters National Criterium Championships.  After my call-up, I waited patiently at the line and just wanted to get out on the course.  The whistle blew and we were off.  The first few laps were painfully slow and I knew that I need to get my legs moving (and get them moving on my own terms).  So, I did exactly what Chuck had told me to do.  I put an attack in going into the 4th lap and made people chase, I moved from one side of the course to the other and made them chase again.  At this point, the announcers went nuts and were announcing me as putting on an attack through the start/finish area.  Other attacks came and went and the pack stayed together.  I kept hearing Chuck and his advice in my head.  I needed to make sure I was staying good position and didn’t want to burn all my matches.  With three laps to go, and the entire field together, I knew I had to be aware of where everyone was and be ready to respond.  Nothing was happening in the field, nobody was attacking, so I patiently kept my position and knew I could not be at the back of the field.  At one point, I fell back and I had to put in a little effort at one point to be back around the front, but I knew it was necessary.  Leading into the last lap, I was sitting 5th.  I knew sprinting wasn’t my biggest strength (as did Chuck), but he had been specifically training me to be able to do these kinds of efforts at the end of a race.  As we entered the last turn into the finishing straight away, it was time to put in one of those efforts in.  I knew it was still a little too early for me to go, so I was sitting on a wheel (in 5th place) conserving as much energy as possible.  Then, I knew it was time to go, it was now or never.  I dug down deep and knew I could pick off the woman in 4th place and all of a sudden I passed her.  We were coming up to the finish line and I wasn’t going to let up.  I kept pushing through the pain, and at the line, I took another one of my competitors at the line to capture the bronze medal in the 2018 Masters National Championships, something I never thought I would accomplish.

I will end this race report with……FRC pull:  I hate them, but I love them.  They crush my soul during my workouts but make accomplishments like this possible.  Thanks Coach!!

Race Report: Performance Evaluation at its best

The race is over, you have made it back home. Your to-do list includes cleaning your bike, looking over your training plan for the next day, and uploading your data to Training Peaks and maybe Strava. What else is missing? Your Race Report.


From a coaching perspective, race data is pure gold. Due to adrenaline, expectation, stress, and competition, racing provides excellent insight into an athlete’s potential. Tons of data, each bit, can be analyzed and interpreted. All of this is objective. However, there is a subjective portion of this analysis that is equally, if not sometimes, even more important. The racer’s evaluation and this piece of the pie are the one most overlooked.


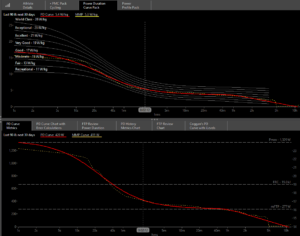
Race Report Power Distribution Curve
Athlete Power Distribution Curve – WKO4

Quantifying performance during a race is easy with all of the gadgets available, from power meter to heart rate to SMO2 monitors. Training Peaks and WKO4 provide the analysis tools. However, the race narrative requires more information. What was your Rate of Perceived Exertion (RPE)? How well did you hydrate before the race? Is work stressful? The mechanism to capture all this data is the Race Report.


Amateur racers come from all walks of life, switching from spandex to business attire come Monday morning. So when they take the preverbal pen to paper, the output is equally diverse. Race Reports range from the coldly analytical to the award-winning novelette. Some reports are informal storytelling around the coffee shop while others appear on a blog. While the style and means of dissemination differ, effective Race Reports contain the same item, the athlete’s reflection on their performance.


The Race Report helps the athlete reflect on his experience. What went well? What failed? Were goals met? Why or why not? The Race Report gives the coach invaluable information to be used in training plan development. It is the story behind that new FTP number or new 1-minute power number. For example, a CX racer felt he had mounting/dismounting down. During a race, he came into the barriers slightly ahead of three riders. Post-barrier, he found himself in fourth. How could this happen? That experience, not visible in just data, gives insight on the confidence and the speed the athlete could negotiate on this part of the course.


The Race Report also provides an interesting mental picture of the athlete and the race. Ironically, when an athlete does well, they respond with talking about tactics and making the break. When their expectation is not met, it shifts to fitness and preparation. The Race Report provides the ice-breaker for some tough conversations. For example, a female athlete wanting to podium at a major race has the power numbers to finish in the top 3 in most local races, yet lacks confidence during more aggressive crits. The power files show matches still left to burn, and the Race Report tells of losing position in the final lap. The numbers show it was not fitness that held her back, rather confidence and opens to door to the discussion of racing in a couple of men’s fields to overcome this challenge.


For a coach, the most useful aspect is the insight on their actual power numbers. If the athlete hit a new five-minute number, was it because they were trying to bridge and the “rabbit” in front of them was enough to get them not to sit up at the four and a half minute mark.


The Formula Template


There is no formula for writing a race report, but here is a simple template that I use.


The Event
– Name
– Where
– When
– Type
– Finishing position and the number of racers


Course description – nothing too long but note any key elements. An eight corner crit is very different than a crit on an oval track.

The content of the race reports provides the reflection of the athlete on their performance. A quick note on timing. Bicycle racing is like everything else. Ofter a day a good performance, becomes great, at the end of the week, it becomes eligible for the archives on Mount Olympus. For a bad performance, each day it worsens. So take the time, the evening of the race, or at the latest the next day, to write out your thoughts.


Warm-up / Prep – this is a significant category. What was the athlete’s mood? How did they sleep the night before? What was their nutrition? Did they follow their pre-race schedule? (More on this in a future entry)


Assessment of their training – this helps the coach and the athlete fine tune their training. Does the athlete think that they were ill prepared for the power requirements of the race? Did they get dropped because they just could not match the strength of the rider in front? Did they ride off the front because the other riders just could not keep up with them?


The Race


This is a narrative of the race. In the athlete’s view, how did it play out? What were their failures and their successes? What could they have done better? Talk about the finish. Was there a sprint finish, how did they feel? Were they tactically sound?


If they were first, how did they get there? If they were on the podium but not the top step, why not first? If they were just field fodder, why did I lose?


Yes, writing a race report takes time and thought. I like to have my athletes either write them that Sunday night or reflect on their performance during their Monday recovery ride and then after the ride write it out. A good race report will give both the athlete and the coach a valuable means of evaluating their performance and should be completed after every race, from first place to a DNF.


Don’t wait too long to write the Race Report or it turns into a fish story….good races become Olympic Gold medal stories, and bad races are epic fails.


Want to read some of KyleCoaching athlete’s Race Reports?  They are here.