When it comes to body composition, people use many different phrases. Many of these terms are misunderstood and used incorrectly. A client once said his BMI was 22% and he wanted to get it down to 10%. He said BMI but meant body fat percentage. This article sifts through the terminology, provides a proper definition of each, and applies it to weight loss, body composition, and cycling.
What does each mean?
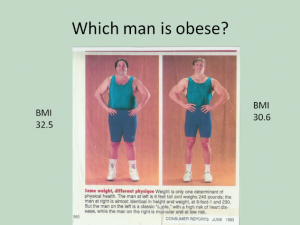
In the early 19th century, a Belgian mathematician, Lambert Adolphe Jacques Quetelet, came up with a formula that showed “the weight increases as the square of the height (Eknoyan 2008)”. Ancel Keys renamed this formula the Body Mass Index in 1972. In 1985, the U.S. National Institutes of Health popularized the index to classify obesity. BMI puts all individuals into one of four categories: “underweight,” “normal,” “overweight,” or “obese.” The measure does not take into account the distribution of body fat or distinguish between lean and fatty mass (Singer-Vine 2009). This ratio between height and weight is merely that, a ratio. It is not a person’s percentage of body fat. As an example, a BMI greater than 30 is considered obese. Therefore, both men in the picture are considered obese by BMI standards.

Unlike BMI, body fat percentage (BFP) is the total mass of fat divided by the full body mass, multiplied by 100. Body fat includes essential body fat and storage body fat (Body Fat Percentage n.d.). Body fat percentage is a measure of fitness level because it is the only body measurement that directly calculates a person’s relative body composition. It is independent of height and weight. In Racing Weight, Matt Fitzgerald states the average body fat for a professional cyclist is 6-11% for men and 12-16% for women. (Fitzgerald, Racing Weight: How to get lean for peak performance 2012). While body composition is an excellent predictor of performance at all levels of cycling (Fitzgerald, Why Are Leaner Athletes Faster? 2018), it does not guarantee a place on the podium.
The last measurement that we discuss is the power to weight ratio or watts per kilogram (w/kg). Dr. Andrew Coggan compiled some common power-to-weight ratios for professional, amateur, and recreational cyclists. This data helps determine what an athlete will likely need to achieve to be competitive with athletes at the same level. For instance, an amateur category 3 male cyclist must produce approximately 3.73 watts per kilogram for his FTP (Functional Threshold Power) to be competitive with another category 3 cyclist. Power to weight ratio is an excellent way of comparing apples to apples across cycling disciplines and categories.
Why does this matter?
A balance exists between body composition and watts per kilogram. There is a point at which too much weight loss can negatively impact an athlete’s power output. Additionally, too much lean body mass which increases body weight will decrease the power-to-weight ratio if that extra muscle does not generate more power. To solve this problem, you need to determine the optimal body fat percentage and corresponding body weight which yields the highest power-to-weight ratio. How to begin? Start with a smart scale which measures body composition. Determine your ideal race weight. (A good calculator: http://www.racingweight.com/rwe/index.html#/). Then using strength training, cardiovascular training, and proper diet and work toward that goal.
References
“Body Fat Percentage.” Wikipedia. n.d. https://en.wikipedia.org/wiki/Body_fat_percentage (accessed December 2, 2018).
Eknoyan, Garabed. “Adolphe Quetelet (1796–1874)—the average man and indices of obesity.” Nephrology Dialysis Transplantation 23, no. 1 (January 2008): 47-51.
Fitzgerald, Matt. Racing Weight: How to get lean for peak performance. Boulder: Velopress, 2012.
—. “Why Are Leaner Athletes Faster?” Competition Running. November 5, 2018. https://running.competitor.com/2018/11/nutrition/why-are-leaner-athletes-faster_175805 (accessed December 2, 2018).
Singer-Vine, Jeremy. Beyond BMI: Why doctors won’t stop using an outdated measure for obesity. July 20, 2009. http://primary.slate.com/articles/health_and_science/science/2009/07/beyond_bmi.html (accessed December 1, 2018).


